Wednesday, May 27, 2015

An awful rather than awesome presentation image


On May 20th at the Ethos 3 Blog Leslie Belknap discussed 3 Simple Tips for Creative Data Visualization which were to:

1)  Get real with your data.

2)  Use scale to tell a story.

3)  Add meaning with metaphors.


She began her first item by warning to:

“Banish bar graphs and pie charts from your repertoire; never use cliché charts and graphs again.”

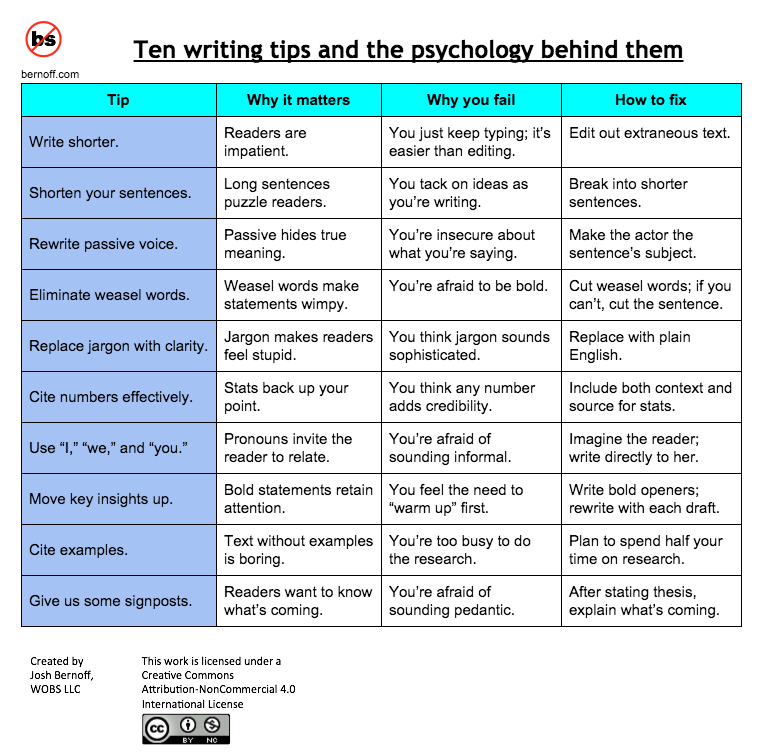
Unfortunately her example for #3 was pretty awful and resembles the silly image shown above. (In it I have replaced all her body text with just the word blah). Her example illustrated a brief article by Laurel Delaney at Verio.com on Ten benefits of cloud computing. Leslie just put all ten headings from there on one slide in all CAPITAL LETTERS, with inverted lollipops (rather than bullet points) overlaying a cloud image. There were 37 words and almost 250 characters, which is way too long for a tweet.

She claimed:

“Even though ‘cloud computing’ has nothing to do with weather, or clouds in the sky, the image of clouds gives viewers a recognizable object to associate with your message. The familiar image serves as an anchor that will help your message stick in your audience members’ memories.” 

I think instead a cloud is a cliché image that also should never be used.

Laurel’s article had said those 10 benefits were (shown here with headings in italics):

"1]  Achieve economies of scale. Increase volume output or productivity with fewer people. Your cost per unit, project or product plummets.

2]  Reduce spending on technology infrastructure. Maintain easy access to your information with minimal upfront spending. Pay as you go (weekly, quarterly or yearly), based on demand.

3]  Globalize your workforce on the cheap. People worldwide can access the cloud, provided they have an Internet connection.

4]  Streamline processes. Get more work done in less time with less people.

5]  Reduce capital costs. There’s no need to spend big money on hardware, software or licensing fees.

6]  Improve accessibility. You have access anytime, anywhere, making your life so much easier!

7]  Monitor projects more effectively. Stay within budget and ahead of completion cycle times.

8]  Less personnel training is needed. It takes fewer people to do more work on a cloud, with a minimal learning curve on hardware and software issues.

9]  Minimize licensing new software. Stretch and grow without the need to buy expensive software licenses or programs.

10] Improve flexibility. You can change direction without serious “people” or “financial” issues at stake. "


Point #9 restates part of #5, so there really were nine points that could have been summarized less painfully in three slides with three each.

On July 2, 2014 at the Ethos 3 Blog Leslie’s boss Scott Schwertly  had discussed 33 presentation tips in 140 characters or less. She violated both his #21 and #24 which were:

“21.  Avoid using all capital letters in a presentation. IT LOOKS LIKE YOU ARE SCREAMING AT THE AUDIENCE.

24.  Skip bullet points; stretch a list into multiple slides. Share only one idea per slide to keep your audience engaged.”


An image with ten different ideas won’t stick in your memory -  instead it will slide right out. Is that why they call it a slide?

Tuesday, May 26, 2015

A curious Top 100 Phobias List from FearOf.net


At LInkedIn Pulse I saw an article posted on May 15th by Grant Cardone on Overcoming the fear of public speaking that began:

“Are you scared of speaking in public? Do you have stage fright? Glossophobia, the fear of public speaking, is ranked #13 on the Top 100 Phobia’s in the World, higher than the fear of failure, the fear of being alone, and the fear of the unknown.”

I had not seen that list of phobias before, so I searched for it on Google and found it came from a page on a web site called FearOf.net by Jacob Olesen which claimed:

“These are the top 100 phobias in the world, with the most common ones listed from the top. You can click on each phobia to learn about causes, symptoms and treatments.”


His top 20 phobias from that list are shown above. (Click on the image for a larger, clearer view).  Spiders are #1, snakes are #2, heights are #3, being alone is #14, Failure is #15, and the unknown is #27. I’ve always been suspicious of lists that only show a ranking without giving a measurement (like percentages or number of Google or Yahoo search results) that would let you determine if adjacent items are nearly the same or very far apart.


Where had that list come from? As far as I know there has never been a worldwide survey, or one with a hundred different phobias. So I took his 100 phobia names and did a stack of Google searches with the very different Top 20 rankings based on number of search results shown above. Xenophobia, fear of the unknown (#1) stood out like a sore thumb, with 7,140,000 hits compared to only 865,000 for Agoraphobia (#2). The horizontal scale was set at 1,000,000 so the relative rankings of the other top 19 phobias would be clearly visible. Where is Glossophobia? It’s twenty spots further down, at #33 on my list rather than at his #13. 

The 20th one (his #51), Anatidaephobia, like the others has a whole page at FearOf.net about cause, symptoms, diagnosing, and overcoming. That is hilarious considering that Anatidaephobia is not real. It was dreamed up by the cartoonist Gary Larson as a very specific form of paranoia defined by a caption which read:

“Anatidaephobia: The fear that somewhere, somehow, a duck is watching you.”

I blogged about it back in 2011, and also have blogged in 2012 about another of Gary Larson’s comical creations that didn’t wind up on the FearOf.net list:
 
“Luposlipaphobia: The fear of being pursued by timber wolves around a kitchen table while wearing socks on a newly waxed floor.”

Mr. Cardone’s article gives a series of tips.His paragraph for #3 Speak to everyone in the room and connect ends with a misquote:

“ ‘Everyone communicates, few comment,’ said John Maxwell.”

John C. Maxwell actually wrote a well-known book titled Everyone Communicates, Few Connect.

The image of Col. Jas. Guffey reading came from the Library of Congress.

Wednesday, May 20, 2015

Is that an infographic or just a totem pole scroll?


CONTENT

An information graphic (infographic) provides real information enhanced by graphics. A totem pole just recounts tribal legends.

First, consider fear of public speaking. Matt Eventoff has an excellent infographic that describes 12 Tips to Overcome Public Speaking Jitters.

Contrast that with the silly Miami Public Speakers Fear of Public Speaking Infographic, which begins by claiming that the National Institute of Mental Health (NIMH) said that 74% of people suffer from speech anxiety (73% of men and 75% of women). Those percentages instead just are legends from a web page at the Statistic Brain web site. There is an infographic from Best Master’s Programs in Counseling on Understanding Fear: What Are Phobias? that charts ten of them from another Statistic Brain web page.   

Second, consider body language. 3103 Communications had Public Speaking: A Whole Body Affair Infographic that repeats the silly Mehrabian Myth without referencing where those percentages came from. Another Body Language Infographic from Nick Morgan and Gengo also unfortunately included that myth - along with 15 useful points. 

Joe Shervell produced what he titled A 9-Step Cheat Sheet for Becoming a Public Speaking Expert that was posted several places including The Accidental Communicator, Moving People to Action, Inter-Activ Presenting & Influencing, and Ragan.com. No one noticed that Joe's 10 headings actually were:

1.   Plan Real Speech
2.   The Importance of the Title
3.   What to Include
4.   Kiss and Tell Preparation
5.   9 Guaranteed Ways to Make an Impact
6.   4 Essentials for 24 hrs Before the Speech
7.   9 Tips for Taking the Stage
8.   10 Tips for Speech Delivery
9.   Some Tips from the Pros
10. 3 Ways to Make a Speech Memorable at the End

That reminded me of the infamous Monty Python skit about The Spanish Inquisition where they keep adding one more item to their lists.

Back on November 6, 2013 one of Zach Weiner’s Saturday Morning Breakfast Cereal parodied infographics in a cartoon with The Top 6 Reasons This Infographic Is Just Wrong Enough To Sound Convincing.


FORM

As shown above, scrolls are an old way of packaging text - but usually horizontally. Vertical scrolls can be viewed on a computer via the up and down keys. Megillah (The Scroll) is a Hebrew word referring to The Book of Esther. The current Merriam-Webster dictionary instead derisively defines a megillah as:

“a long involved story or account.”

It sometimes is redundantly prefaced with the word whole, but I’ve never heard anyone ever refer to a partial megillah. Gavin Meilke noted at Inter-Activ Presenting & Influencing regarding infographics that:

“What I dislike is the way that they cram so much stuff into one enormously long image that doesn’t print out to any normal paper size. Why won’t somebody create an infographic that is paginated for printing – I like paper and I am sure I am not alone!”   

On January 13th I blogged about How to infuriate readers of your blog. That post described another disadvantage of the infographic format - one titled LET TED DO THE TALKING: 8 TED TALKS THAT TEACH PUBLIC SPEAKING couldn’t include clickable links to those presentations. 

The image of a Totem Pole came from Wikimedia Commons, and the image of a monk reading a scroll came from the Library of Congress.

Sunday, May 17, 2015

Prop demonstrations during lectures increase student performance in biology courses


Simple props can help present complex concepts. For example, a twisted cord on ear bud headphones can be used to demonstrate DNA replication, as described here.

A recent magazine article by F.  Tamari, K. M. Bonney and K. Polizzotto of the Kingsborough Community College in Brooklyn discussed how Prop Demonstrations in Biology Lectures Facilitate Student Learning and Performance. It appeared in the Journal of Microbiology & Biology Education, May 2015, vol. 16 No. 1, pages 6 to 12.


Table 3 of that article showed significantly higher scores on questions for students who had seen five demonstrations (blue) than those who had not (yellow), as is shown above in a bar chart.   

Friday, May 15, 2015

Do reporters have shorter attention spans than goldfish?


They probably do. Microsoft Canada recently posted a brief article about How does digital affect Canadian attention spans? It provided a link for downloading a  detailed 52-page research report. Unfortunately it also mentioned that:

“The average human attention span in 2000 was 12 seconds, but by 2013 it was only 8 seconds (1 second shorter than a goldfish!).”    

That was NOT something found by the Microsoft research - it was three attention span statistics (listed on page 6) quoted from a  dubious web page at Statistic Brain, which I blogged about last December in a post titled Statistic Brain is just a statistical medicine show. I blogged about it again in April in another post titled What’s worse than being the boy who cried wolf? It’s being the girl who cried goldfish!

Page 9 of the Microsoft report introduced the research topics by describing how:

“This study breaks attention into three parts because we don’t think attention can be simply characterized as how long people can concentrate - different tasks, devices, and lifestyles require different sets of attention types.

3 types of attention:

SUSTAINED
Prolonged focus
Maintaining prolonged focus during repetitive activities

SELECTIVE
Avoiding distraction
Maintaining response in the face of distracting or competing stimuli

ALTERNATING
Efficiently switching between tasks
Shifting attention between tasks demanding different cognitive skills”


Did reporters talk much about those distinctions? Of course not! The May 14, 2015 article at TIME by Kevin McSpadden was titled You Now Have a Shorter Attention Span Than a Goldfish and claimed:

“The average attention span for the notoriously ill-focused goldfish is nine seconds, but according to a new study from Microsoft Corp., people now generally lose concentration after eight seconds, highlighting the affects (sic) of an increasingly digitalized lifestyle on the brain.”

That day’s article at USA Today by Neal Colgrass was titled Our attention span now worse than goldfish’s, and similarly said:

“...the Canadian attention span has dropped from an average of 12 seconds in 2000 to the jittery low of eight seconds today. ”

An image showing reporter Sean Michael Thomas of Russia Today in Antarctica came from Wikimedia Commons

Tuesday, May 12, 2015

How not to tell a story with an image - the “Roswell Slide”

On May 5th the Coast to Coast AM radio show had a segment on Roswell Alien Slides. You can hear part of the audio here at YouTube. They posted an image on their web site showing a body lying on a glass shelf. There seemed to be a placard at the lower right. To me it looked like a photo of a museum exhibit. But, they said instead it was Not Of This Earth:

“Dolan noted that the experts found the creature depicted in the slides to be anomalous, and though damaged or decomposed it was not mummified. Nor was it believed to be a mammal or human.”

In Poor Richard’s Almanack Benjamin Franklin quipped that fish and visitors smell in three days. On May 8th a web site called Blue Blurry Lines posted about The placard of the Roswell slides: The final curtain. They said that the first line actually read:

“MUMMIFIED BODY OF TWO YEAR OLD BOY”

The whole fiasco can be summarized by three headlines from newspaper articles in The Mirror:

May 4th - Unseen Roswell ‘alien’ photos to be unveiled tomorrow -are they an extraterrestrial smoking gun or a cruel hoax?

May 6th - Roswell Slides Unveiled: UFO fans left heartbroken by Area 51 ‘alien’ photo unveiling which was ‘an epic fail.’

May 11th - The Roswell Slides: UFO researcher apologises after admitting ‘dead alien’ picture actually showed the mummified body of a child.


UPDATE

On May 11th the Coast to Coast AM web site briefly noted 'Roswell Slide' Revealed to be Mummified Boy

You can hear four parts of the May 5th Coast to Coast AM broadcast posted on YouTube by Paranormal Matters:
Part 1   Part 2  Part 3  Part 4

Friday, May 8, 2015

10 great tips for speechwriting from Josh Bernoff


In a post on his Without Bullshit blog on May 4th Josh Bernoff describes 10 top writing tips and the psychology behind them. They are:

1.   Write shorter.
2.   Shorten your sentences.
3.   Rewrite passive voice.
4.   Eliminate weasel words.
5.   Replace jargon with clarity.
6.   Cite numbers effectively.
7.   Use “I," ‘we,” and “you.”
8.   Move key insights up.
9.   Cite examples.
10.  Give us some signposts.

His tips are general, but they apply to writing speeches. Josh even provides a downloadable chart with each Tip, Why it matters, Why you fail, and How to fix.

Wednesday, May 6, 2015

Not telling the truth with charts


Yesterday Seth Godin blogged about Telling the truth with charts, but he didn’t really. He began with the second chart from an article by Jordan Weissmann on The Decline of the American Book Lover  in The Atlantic last January. He whined that it presented color coded data from three years (Gallup  1978 and 1990, and Pew 2014) shown in reverse chronological order, and five sets of percentages for number of books read (none, 1 to 5, 6 to 10, 11 or more, and no answer). Seth claimed the 1990 Gallup poll told us nothing, omitted it, and also dropped the no answer category. Then he left out the 1 to 5, and 6 to 10 books read categories. What was left is a comparison of 1978 and 2014 data for number of books read (none, or 11 or more). He showed the following chart, which has serious problems of both form and content:


The form problem is his use of red and green colors, which I have called Christmas Camouflage because some color blind people will see both as olive drab, as shown above in the Vischeck Deuteranope Simulation view at the right.

The content problem is a change of scale between the results for zero books and heavy readers (more than 11 books). For zero books the left bar represents 8%, while for heavy readers the right bar with the same height represents 28%. Also, the left chart runs downward from zero while the right chart runs upward from a different origin. For heavy readers the left bar (for 42%) should be 1.5 times the height for 28% but instead is 2.5 times that height. An honest chart with the same scale and origin reveals that there still is a higher percentage of heavy readers (28%) than non-readers (23%) and it looks like this:


Does the 1990 Gallup Poll tell us nothing? No, it tells us something useful - that the percentages were changing from those the measured in 1978, and so the difference for 2014 is not from Pew and Gallup just phrasing their questions differently. Here is another honest chart including that data:


Tuesday, May 5, 2015

17 delusion-like beliefs of British adults


I was taught that logos (logical argument) was an important part of public speaking, but now I’m having second thoughts. Recently I read a magazine article by psychologists Rachel Pechey and Peter Halligan titled The Prevalence of Delusion-like Beliefs Relative to Sociocultural Beliefs in the General Population that appeared in 2011 on pages 106 to 115 in Vol. 44 of Psychopathology magazine. You can read the abstract here (and find the full text by a Google search of the title in quotes with the added phrase filetype:pdf).

They developed the Cardiff Beliefs Questionnaire (CBQ), which includes 46 questions. 19 are about political, social and science-related beliefs. 10 are about paranormal and religious beliefs, and 17 are about delusion-like beliefs (10 bizarre).  A telephone survey using the CBQ was done on a sample of 1000 British adults (52.1% female and 47.9% male). (The CBQ does not ask if you believe that Cardiff is the capital of Wales).

First, let’s look at ten bizarre delusion-like beliefs in British adults. The total percent who strongly, moderately, or weakly believe them is shown first, and the percent who strongly believe them also is shown in [square brackets]. The type of delusion is shown in parentheses.

1.   44.3% - You are not in control of some of your actions  [10.8%] (Controlled actions).

2.   38.7% - Certain places are duplicated, i. e. are in 2 different locations at the same time  [6.8%] (Reduplicative paramnesia (place)).

3.   33.6% - Your thoughts are not fully under your control  [6.2%] (Controlled thoughts).

4.   32.7% - There is another person who looks and acts like you  (5.4%) (Subjective doubles).

5.   26.2% - Some people are duplicated, i. e. are in 2 places at the same time  [4.1%] (Reduplicative paramnesia (person)).

6.   24.9% - People you know disguise themselves as others to manipulate or influence you [4.4%] (Fregoli).

7.   18.4% - The reflection in the mirror is sometimes not you  [2.6%] (Mirrored-self misidentification).

8.   6.1% - Part of your body does not belong to you  [1.1%] (Somatoparaphenia).

9.   5.8% - Relatives or close friends are sometimes replaced by identical looking impostors  [0.4%] (Capgras).

10.  5.4% - You are dead and/or do not exist [0.9%] (Cotard).


Comedian Flip Wilson used to do a specific version of Number 1 - where his character Geraldine Jones lamented that The Devil made me do it. Numbers 2 and 5 violate the tagline in the Highlander films that There can be only one.

Another seven delusion-like beliefs of British adults are:

11.  46.4% - Your body or part of your body is misshapen or ugly [10.8%] (Body dysmorphia). 

12.  40.5% - You are an exceptionally gifted person that others do not recognise [3.8%](Grandeur).
 

13.  38.5% - People say or do things that contain special messages for you [7.0%](Reference).

14.  33.8% - Certain people are out to harm or discredit you [6.5%] (Persecution).

15.  12.9% - The world is about to end  [1.7%] (Nihilism).

16.  12.4% - You are infested by parasites  [2.8%] (Parasitosis).

17.  6.9% - Some well known celebrity is secretly in love with you  [1.0%] (Erotomania).


I saw the magazine article mentioned in an article by Graham Lawton on pages 28 to 33 of  the April 4, 2015 issue of New Scientist titled Beyond Belief that you can read here. It was also slightly delusional - only mentioning Peter Halligan and ignoring the senior author, Rachel Pechey.   

The image was adapted from one for Acute Dementia found at the Images from the History of Medicine web site.

Monday, May 4, 2015

Ask yourself questions before you try to turn a fear into a habit


On April 26th Seth Godin blogged that:

"To overcome an irrational fear... replace it with a habit.

If you're afraid to write, write a little, every day. Start with an anonymous blog, start with a sentence. Every day, drip, drip, drip, a habit.
 

If you're afraid to speak up, speak up a little, every day. Not to the board of directors, but to someone. A little bit, every day.
 

Habits are more powerful than fears."

That’s broader and much briefer advice than his post three months earlier on Fear of public speaking. On January 30th I blogged about how Seth Godin gave an incomplete solution for fear of public speaking. Here is the other part he missed.

His recent advice has the same problem as before - assuming that desensitization alone will take care of things. It might not, so it would be better if you also asked yourself questions about what is bothering you.

Friday, May 1, 2015

What tools wil public speakers be using a decade from now?


I’m not sure, but they may include smartglasses like the Google Glass shown above. At the very least it could be used as an almost invisible teleprompter. Smartglasses also could give you a presenter view of the slides or video so you don’t need to turn around to face the screen and ignore the audience. Back in January 2010 I blogged about other software that provided Visual feedback for vocal variety.

On March 30th the University of Rochester had a press release about how Wearable technology can help with public speaking. It described a real-time feedback system called Rhema for both volume and speaking rate. Details are in an article by Tanveer, Lin, and Hogue. The press release began by stating that speaking in public was the top fear for many people, with the implication that new technology would help. (A six-page article about teleprompters in the Saturday Evening Post for September 14, 1957 was titled “Sure Cure for Stage Fright”).

Maybe in a decade displays like descendants of Google Glass will seem normal. I still find them a bit creepy. That’s probably because I first saw similar devices worn by the nasty Borg on the TV show Star Trek: The Next Generation back in 1989. Their first communication with us was:

"We are the Borg. Lower your shields and surrender your ships. We will add your biological and technological distinctiveness to our own. Your culture will adapt to service us. Resistance is futile."

The image of Google Glass came from Wikimedia Commons.